Processes on Linux
CheatsheetUnderstanding what’s running on Linux is a vital system administration job. This cheatsheet aims to provide quick reminders on how to query the Linux process structure.
The first command to introduce is ps, but the main ‘gotcha’ with ps is that there are various versions depending on your platform. They can be broken
down into two categories:
- BSD style commands (no dashes required before options)
- UNIX style commands (dashes required before options)
Because we’re focusing on Linux (and therefore UNIX), we’re going to be using dashes with our options. On its own, ps outputs the processes associated with the
current user and terminal. Hence why you might only get a small list when running it (including itself), because a terminal generally isn’t running anything other then Bash. To get more detailed options, we’ll need to go deeper:
Without arguments, the default output is pretty limiting. Use -e to see all processes, and show extra information, such as full path and arguments (-f):
user@linux-host:~$ ps -ef
UID        PID  PPID  C STIME TTY          TIME CMD
root         1     0  1 14:01 ?        00:00:00 /init
root         7     1  0 14:01 ?        00:00:00 /init
root         8     7  0 14:01 ?        00:00:00 /init
john         9     8  0 14:01 pts/0    00:00:00 -bash
john        12     9  0 14:01 pts/0    00:00:00 ps -ef
To limit to a particular user:
ps -f -u root
The additional output option gives a lot more columns of interest. Key ones include ‘PPID’, which lists the parent PID of a process. You can also build a
process tree using ps -ejH. You’ll now be able to see which processes have spawned others.
top
To get a continuous view of what’s going on, you can use the classic utility top, which not only provides process information, but also usage stats. There’s a lot
of data presented in top, but key values to look for are highlighted below:
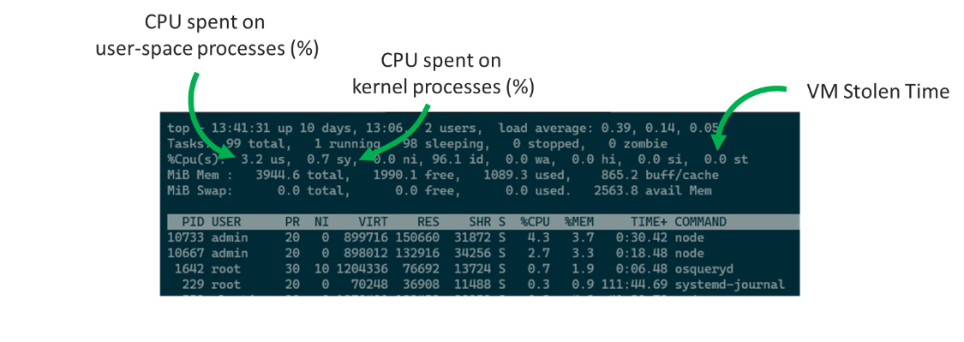
VM stolen time is useful to monitor when dealing with virtual machines. A high value means that the hypervisor isn’t able to dedicate enough CPU cycles to the guest OS, and therefore will negatively impact performance on the machine.
It’s also wise to display memory statistics in a format more suitable, such as GiB instead of MiB:
user@linux-host:~$ top -Eg
When running top, you can quickly sort the CPU and MEM columns for highest values. Use SHIFT-M to sort by memory, and SHIFT-P to sort by CPU usage.